AI progress and a landscape of problem conditions
I’ve mentioned this ‘Zone of Hubris’ idea in a couple of earlier posts, and it’s time I made it clear what I mean by this slightly over-blown phrase.
The basic idea is that the sort of AI we are making at the moment is being developed against a range of problems with very clear success metrics, and relatively high levels of available information. Recent rapid progress is giving rise to significant confidence in our ability to begin to address really useful problems with the aid of AI (nothing in this post relates to currently imaginary super-intelligent Artificial General Intelligence).
This is likely to lead us to seek to apply our shiny new successes more ambitiously – as well we should. But we need to be aware that we have been sharpening these tools in a particular arena, and that it is not at all certain that they will work well in different circumstances.
“Well, of course..” you might say; “we’re quite aware of that – that’s exactly how we’ve been proceeding – moving into new problem domains, realising that our existing tools don’t work, and building new ones”. Well yes, but I would suggest that it hasn’t so much been a case of building new tools, as it is has been about refining old ones. As is made clear in some earlier posts, most of the building blocks of today’s AI were formulated decades ago, and on top of that, there appears to have been fairly strong selection for problem spaces that are amenable to game/game-theoretic approaches.
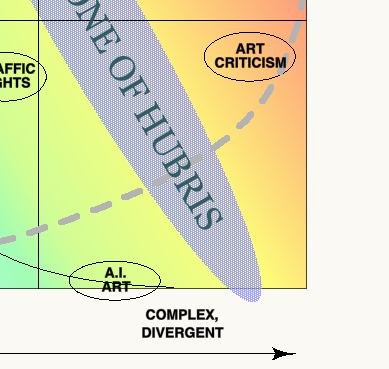
‘Hubris’ is defined as ‘excessive or foolish pride or self-confidence‘. The ‘Zone of Hubris’ refers here to problems which are not only more complex, but crucially where success metrics are much fuzzier than those on which we have been training our AI, and perhaps more seriously, our AI community. The concern is that we might, with an excess of confidence, believe that we can use our new AI tools to address problems with messy success metrics, with insufficient attention to the deep differences these issues present, with potentially dangerous results.
This idea has parallels with the ‘paper-clip maximiser‘ thought experiment first set out by Nick Bostrom in 2003, wherein a super-intelligent AI has been imbued with an overly simplistic reward maximisation function, but here we are concerned with more immediate, much less imaginary (and thus more serious) scenarios.
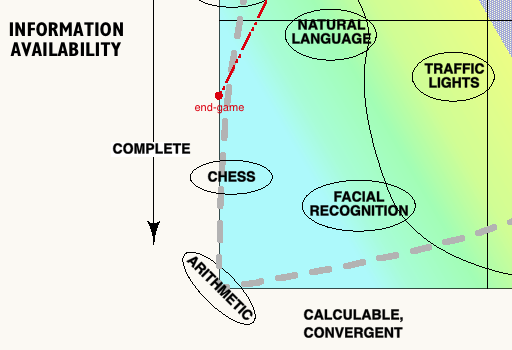
Let’s look at the chart: it sets out a space of issue conditions encountered by intelligences, mapped according to ‘Information Availability‘ on one axis, and increasing ‘Outcome Measure Complexity‘ on the other. A general intelligence, by definition, should be capable of addressing any point on this chart – albeit with varying capacity and quality of outcome.
 ‘Information Availability‘ is a fairly self-explanatory measure, although it should be noted that this doesn’t simply measure access to raw data, but rather access to usable data, so that the problems of an effectively infinite amount of data (as in the game of Go) can be scored on the same axis as situations where data is necessarily incomplete (as in the game of poker). Also note that as the term ‘Obscurity of Information’ is in itself obscure, I’ve used ‘Availability’, and thus the quotient on this axis decreases as we move away from the origin.
The ‘Outcome Measure Complexity’ axis merits some discussion.
At the origin we have binary outcomes; win/lose, right/wrong etc, while at the ‘high’ end are things that are so complex that we can find no metric – where we humans are forced to accept that the quality of outcome is totally subjective, where there is genuinely no ‘correct’ outcome.
At the origin, then, success is both clearly defined and straightforwardly assessed. Increased difficulty in either or both of these conditions pushes an issue rightwards. Towards the centre, though, is where it gets interesting. Problems in this zone have outcomes that humans can certainly ascribe success to, but where the metrics are not simple, or easily arrived at – they may be multi-dimensional, perhaps have recursive loops, or perhaps relate to obscured/contested data.
The colour gradient on the chart is intended (roughly) to represent the difficulty of the problem terrain for AI – from blue; achieved, through green; current limits, yellow; aspirational, to red; currently imaginary. Arguably the gradient should follow a curve with contours more like the curved black line.
The chart is about characterising the range of problems to be addressed by intelligences, and to support thinking about the issues that arise in dealing with them – not about particular systems used by the intelligence to address the problems. With current AI approaches, progress is being made by carefully characterising the conditions of the problem area to be addressed before developing the systems to be used. We decide how to assign/assess the relevant metrics of ‘success’, and we look at the technical aspects of the information space involved.
Let’s explore this landscape in terms of these two issues.
Complete / Convergent
In this quadrant things are relatively straightforward; success metrics are clear, and information is both bounded and available. Thus the relationships between information and outcome are relatively simple and susceptible to analysis. We can make AI that is good at this already, and it is getting better fairly quickly. The extreme example shown is arithmetic – perhaps it should be binary logic.
Incomplete / Convergent
Here, things are harder. Although judgement of outcome quality is still easy, we have problems with completeness of information – either because it is simply unavailable or because there is too much of it to analyse within system constraints. Determining relationships between data and successful outcomes becomes harder – it is the techniques of data analysis that provide the main challenge; we have to use more abstruse data analysis techniques – Monte-Carlo searches, bayesian networks, fuzzy logics, pattern recognition, neural nets and the like.

Here we begin to discover that information availability and success metrics have a deep relationship – for measuring success depends on data from the environment of some sort. As data availability becomes more difficult, it can affect our ability to judge outcomes.
An example here is the problem that the AlphaGo Team had in assessing the state of play during the middle period of the game. As the possibility space for the evolution of the game gets to its richest, it becomes harder and harder to assess whether you are in a winning or losing position. Only by playing millions of games in parallel against itself and other players was AlphaGo able to amass a deep enough ‘understanding’ of the patterns the game can take.
Although the final success metric for Go is a (relatively) simple counting of squares and pieces, determining whether a particular move in the context of a particular stage in the game takes you toward success is much harder. The dotted red line around the ‘Go’ label on the chart suggests that a Go playing intelligence traverses a path through this problem space as the game proceeds.
The extreme in the Complete/Convergent quadrant would appear to be something like tossing a coin whose sides are invisible inside a box with random gravity. Seemingly pointless perhaps – yet humans occasionally find themselves in positions where they must take ‘leaps in the dark’, so this extreme perhaps demands further consideration.
[UPDATE: the relative positions of Poker and Go on the horizontal axis are wrong – the success metric for Poker is trivial – who has all the money – while Go is a little more complex. So Go should be a little to the right of Poker]
Complete / Divergent
In this quadrant, the relevant information is relatively easy to access, but now we need to find ways of assessing the quality of outcomes that have increasingly complex and hard-to-define metrics. Perhaps the extreme example here would be a system that used ‘Game Of Life’ techniques to make abstract sculpture. The procedure from the starting conditions is completely determined, but the quality (or otherwise) of the resulting sculpture is subjective.
Quite sophisticated work has in fact been achieved with AI creativity in both music and the visual arts– (more).However, although these programs produce results whose qualities seem most appropriately judged subjectively, they appear to operate within completely available information spaces, and would thus be positioned close to the bottom axis of the chart – perhaps indicating why, no matter what the judgements made of the work, there is little general interest.
Incomplete / Divergent
Given that the top left and bottom right corners of the chart seem variously intractable and pointless, one might assume that the combination of both extremes would be devoid of interest, utterly impenetrable – or both. But in fact we quickly see that most of the things that humans consider worth spending time using their intelligence on will in fact lie in this quadrant – that it is within this region that we find our most interesting and absorbing questions.
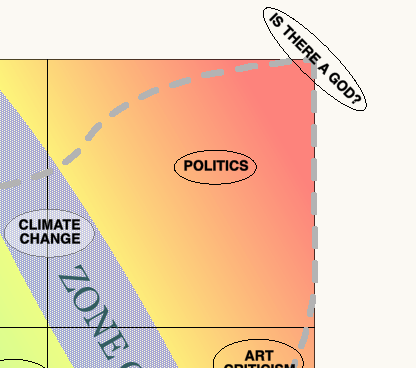
The extreme example here is the utterly subjective question of the existence of supra-real deity, where anything and nothing might be considered as information, and where everything and anything is potentially implicated in the answer.
In this top right quadrant we experience both the difficulty of knowing what a successful outcome looks like, and the difficulty of getting hold of useful information about the issue at hand. These problems in fact compound each other; not being sure what success looks like makes it harder to decide what information to look for, at the same time as the enormous range of potential information, some of which is structurally unavailable, make it hard to measure success.
Human Interest
Although the chart was invented as a platform for thinking about the application of AI across this landscape, it is also interesting to attempt something like a ‘heat-map’ of human interest in issues across the same landscape. I have allocated positions across the chart to various topics, which seem to suggest that this heat-map would occupy a roughly diagonal zone stretching from bottom left to top right. The thick dotted line is an attempt at a more refined contour. Do entertain yourself plotting positions of other issues – or making arguments for why my locations are all wrong. I’d love to hear from you!
Current AI paradigms
Our successes with AI to date are all toward the lower left corner of the chart, and notably almost all in situations where the success metric is clearly defined and straightforwardly assessed. Note that the limit of our current competence is skewed toward problems with increasingly difficult access to useful data, and away from problems with complex outcome metrics. Situations where the quality of outcome is not easily ‘scored’, like the AI creativity work referenced above, are notably minority pursuits.
Natural Language Processing is interesting to consider in this light. The ability to pronounce on the ‘correctness’ of a text produced by an AI declines exponentially with the length of the text (could a novel ever be ‘correct’?). Thus, although AI progress in the NLP space is impressive, with products like Alexa that can ‘make it’ in the complex environment of people’s home lives, and rapidly improving translation tools, it is notable that these are all limited to high quality coherence over the length of a phrase or short sentence, most successfully within defined domains.
The challenge of indeterminate success
The paradigms that underlie most current AI approaches are clearly focused on game-like scenarios, whether these have simple win/lose conditions or more subtle Game-Theoretic measures like minimax analysis (see this earlier post for more on this).
However, as we seek to expand the range of competence of AI systems along the axis of human concern – towards the top right of the chart, we will encounter problems of a different character than those we have so far attempted to address with AI. Nevertheless, this is clearly the ambition of the AI community – and well it should be. When we think about issues like energy grids, congestion, climate change, economic stagnation, it’s very clear that some additional help would come in handy.
And here comes the issue, as I see it. The ‘Zone of Hubris’ thing.
Our current approaches to these problems seem inadequate, and the risks they pose are great. We are making huge strides with AI, and we need help; so – the argument will go – let’s apply these new tools we are developing to these critical issues, and solve the world’s mega-problems.
Indeed, let us! Bring it on! We need all the help we can get. However, we need to be very clear about the tools we have built, and their limitations.
These issues are ones which exhibit true complexity – issues where recursion introduces things like the sensitivity to initial conditions evinced by chaotic systems. Intervention in such systems by definition brings ‘unintended consequences’ at one level or another.
Nevertheless, the problems in the ‘yellow’ zone should all be tractable to some degree – susceptible to modelling and analysis, even if great sophistication is required. So why shouldn’t we use AI to help us with these? What’s the problem? AI is improving in leaps and bounds, so even if these issues are beyond it now, they won’t be for long.
Indeed, we desperately need to develop better tools for addressing complex problem spaces, but as I see it the groundwork for such work has already been laid, both within disciplines like Systems Dynamics and the relationship graphing work developed by tools like Kumu and grakn.ai. This is a large subject, and indeed I believe that tools for addressing complexity without destructive reductionism are a fundamental requirement for human progress, but that’s outside the scope of this article. Let’s assume that this is in hand.
So again you say, what’s the problem? If we accept these last arguments, why am I concerned? Why this ‘Zone of Hubris’ thing?
It’s this:
The issue, as I see it, is not so much with complex relationships in the data, but with complex relationships in the success metrics, and with the weakness humans have with thinking about cumulative consequences. That given the pressing need to address these problems, and given the impressive results of AI in other areas , we may wilfully close our eyes to the difficulty of describing success and simply press ahead, on the basis of deliberately simplified metrics.
Traffic control – an example
To explore this, let’s think about traffic control. How many times have you been at an intersection, waiting for the lights to change, and realised that nobody is moving – that the lights are set up so that there are three, four, five second intervals when nobody can make progress. Or sat watching a light go green for a route where no-one is waiting. Take your pick of news reports – this one suggests that the average UK driver spends “a fifth of their average daily drive waiting at red lights“.
It’s obvious that the worldwide opportunity cost of wasted time at inefficient traffic controls is enormous, and yet the problem seems fairly simple – trivial surely, compared with the impenetrability of judging the state of play on a Go board.
So why is it that AI solutions to traffic control are only in their infancy?
I suggest that it’s because the outcome metrics are complex – really complex. What should we seek to optimise? Vehicle throughput? Safety? Pedestrian throughput? Emissions reduction? Public transport vehicle prioritisation? City-wide congestion minimisation, or local throughput? It is easy to imagine circumstances where one of these would be emphasised over another. Perhaps it’s no surprise that the example linked above is in the USA, where pedestrians come a poor second to drivers in policy terms.
In fact, the article makes it clear that the success metric that this AI has been trained for is crude vehicle throughput, and that the system is junction-specific.
The point to recognise from this example is that despite the wide range of possible judgements of the success of a traffic control system, the AI has been developed on the basis of one simple success metric. All the other questions have been ignored – or at best assumed to follow in the wake of better vehicle throughput; the article happily notes that emissions at the trial junctions have dropped significantly – presumably as vehicles spend less time in stationary ‘idling’ mode. And this, of course, is a Good Thing.
But note that the AI has not been trained with the aim of reducing emissions – this is just a welcome side-effect. Think for a minute about the results of all previous interventions that have ‘increased vehicle throughput’. What have been their effects? That’s it – increased vehicle numbers. Remember the old adage- ‘You can’t pave your way out of congestion‘?

The issue here is that feedback mechanisms have been ignored when opting for simplistic success metrics in a complex situation. It turns out (and this is not news) that a major constraint on the choice of whether to drive or take public transport is congestion – and that the limit is a certain quotient of traffic delay. When you recognise this, you realise that these AI traffic controls are likely to reduce emissions only in the short term, until traffic density increases to bring delays back to the acceptable limit. And if the AI is well designed, and learns to deal with heavier traffic? Well, that will just result in more cars – until poor air quality becomes a political issue – or pedestrian safety, or….
This is the Zone of Hubris – the zone of problems which we might choose to characterise as engineering problems that our wonderful game-trained AI systems can address – but only if we downplay the real-life complexity of outcome, the feedback loops and the sometimes contradictory yardsticks for success.
When the man who has been hammering all his life assumes that every problem is a nail.
[Edit: It is interesting in the context of this example to consider the contrast with the enormous amount of money that has been invested in the AI of self-driving cars – a market that while potentially much larger than that for traffic lights, is at the same time enormously more risky. One explanation for this might be that the success metric for a self-driving car is ludicrously simple compared to that for a set of traffic lights; “Get to the destination quickly; don’t kill anyone.”]
Climate change
The big one, of course, is Climate Change. It is clear that we are going to need significant help digging ourselves out of this hole we’ve dug for ourselves, but what does success look like here? Easy, you might say – global temperature rise kept below 2ºC. Job done. But here the range of measures to be taken into account, and the complex relations between them is exponentially greater than those involved in traffic control.
Because it’s not just temperature rise – the enormous range of feedback mechanisms involved (albedo, methane clathrates, for a couple of examples) will each respond differently to different temperature mitigation strategies, producing outcomes of different characters – some less desirable than others.
And this is not to mention the range of intersecting systems – the water cycle, the nitrogen cycle, soil depletion, the phosphorous cycle, changes to ecosystems, and others, all producing feedback (watch this lovely video on trophic cascades to see how a few wolves can effect large scale landscape changes).
And of course, beyond these are the more human mechanisms – fuel and energy production, storage and distribution, resource use, food production, demographics, population movement as a result of extreme weather events; oh, and politics and economics too.
And all of these mechanisms are not only involved on the information side, they’re also implicated on the success side – do we value GDP above food production? Welcome refugees even if it impacts ecosystem repair? Understand the implications of these choices for temperature rise? Not to mention the fact that the amount of data generated by all of these systems is impossibly large and multi-dimensional, which also impacts our ability to measure success, as we have seen.
OK, it’s a big problem, but am I seriously suggesting that we shouldn’t use AI to help us address it?
No, really, I’m not. But what I am saying is that we need to do some work on something that we haven’t worked on at all, as far as I can see – developing AI that can operate in situations where the success metric is deeply complex.
Which, as far as I can see, means we need to develop AI ethics. Not so that a super-intelligent AI will be friendly, but more urgently so that a fairly dumb AI will help us address the issue of what success looks like in a complex world, without deciding that the best way to keep the temperature rise to 2ºC is to cover America with tinfoil.
More on ethics and AI to come.
[Edit: I was interested to come across a somewhat parallel analysis and a strikingly congruent graph in a talk by Monica Anderson, CEO of Syntience, an AI firm which states as its mission that it is developing; “A New Approach To Computer Based Natural Language Understanding“. The video is here (graph 17’30” in).]
[Edit: this Medium post by Daniel Bilar on ‘Systemic Security’ examines specs within which AI’s interact with simple success metrics in a complex environment – high-frequency trading – and illustrates the systemic fragility of such systems.]

I think carefully considering these different problem spaces will lead to more effective AI development.
LikeLike